How to Use Chart Patterns to Set Entry and Exit Points in Trading

Chart patterns are one of the most powerful tools in a trader’s arsenal. Whether you’re trading stocks, forex, or cryptocurrencies, understanding stock chart patterns can help you predict market movements and make smarter trading decisions. These patterns, formed by price movements and trendlines, act as a roadmap for setting precise entry and exit points.
By mastering trading chart patterns, you can identify when to enter a trade to maximize profits and when to exit to minimize losses. This guide will walk you through the most common chart patterns, how to read them, and how to use them effectively in your investment strategy.
- Use continuation patterns to set price targets and ride the trend.
- Use reversal patterns to exit before a trend reverses and minimize losses.
- Always use stop-loss orders to protect your capital from unexpected market moves.
Understanding Stock Chart Patterns and Their Role in Trading

Stock chart patterns are simple shapes or formations that appear on a chart when you track price movements. These patterns can help you predict what the price might do next. They fall into two main groups: continuation patterns and reversal patterns. Both groups are useful for setting entry and exit points in trading.
What Are Chart Patterns?
Chart patterns are the shapes formed by price moves over time. When traders look at these patterns, they often see clues about where the price might go next. Knowing how to read these patterns can help you decide when to buy or sell stocks, crypto, or other trading instruments.
Two Main Categories of Chart Patterns
- Continuation Patterns: These patterns show that the current trend will likely continue. Examples of continuation patterns include flags, pennants, and triangles. When you see a continuation pattern, it tells you that you can likely keep trading in the same direction. For instance, if the market is rising and a flag pattern appears, the trend may continue upward after a short pause.
- Reversal Patterns: These patterns signal a change in the current trend. Patterns like head and shoulders, double tops, and double bottoms can show when a trend is about to reverse. Recognizing these reversal patterns can help you avoid losses by letting you know when to exit a trade or when to enter in the opposite direction.
Understanding the difference between these two types of patterns is a key step in setting your entry and exit points. The easier it is to spot a trend change or a continuation, the more accurate your trading decisions will be.
Common Types of Chart Patterns Used to Set Entry and Exit Points

Let’s look at some common chart patterns that traders use to set entry and exit points. Each pattern gives a hint about what the market might do next.
Continuation Patterns
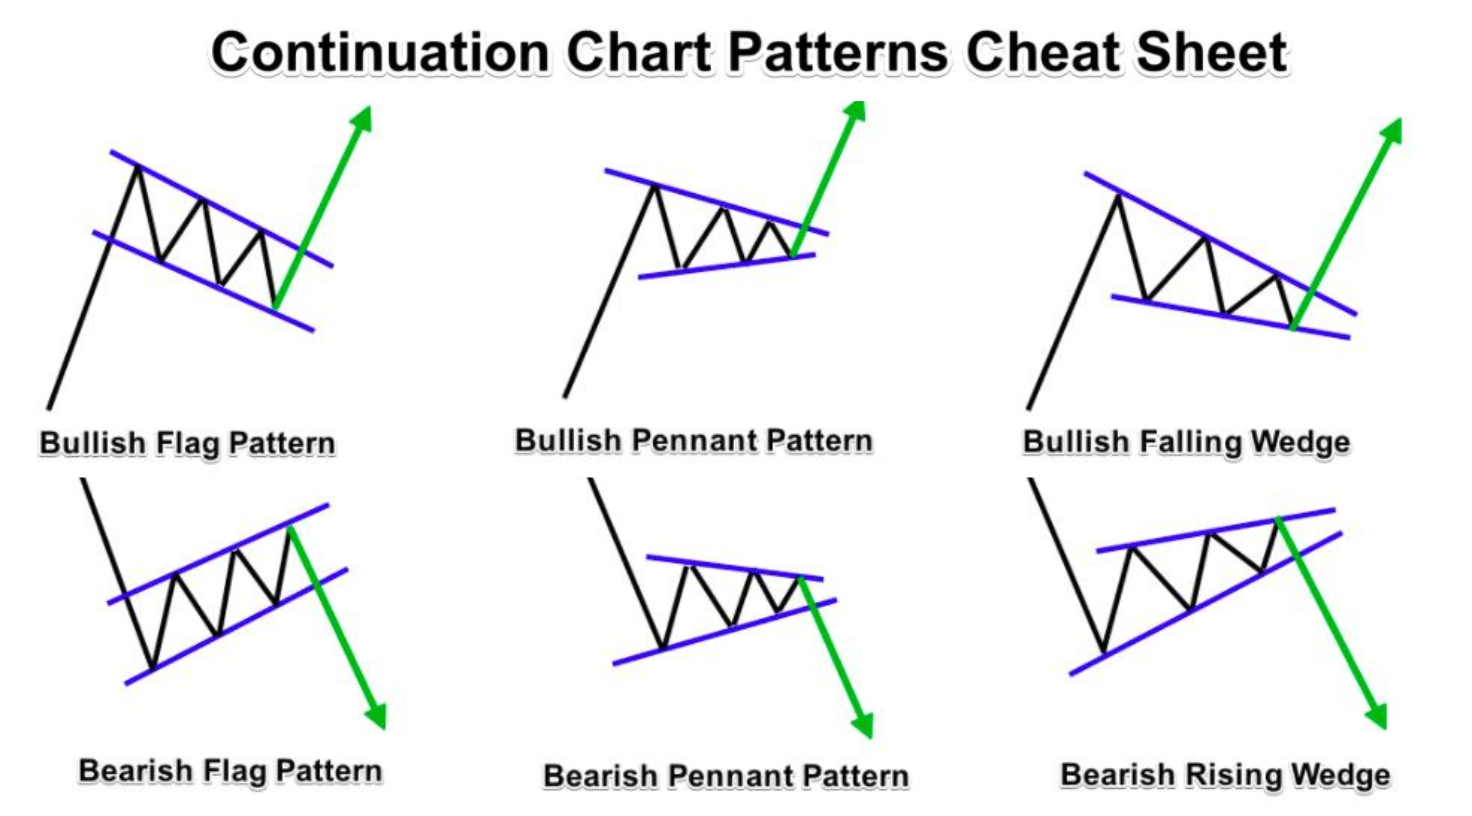
Pennants: Pennants are small triangle shapes that form after a strong move. They show that the market is taking a short break. To use a pennant pattern, look for two trendlines that come together. When the price breaks out of this shape, it may be a good time to enter a trade. For example, if you see a bullish pennant in an uptrend, you might set your entry point as the price breaks above the pennant.
Flags: Flags look like small rectangles that form after a quick move up or down. They happen during a pause in a strong trend. When you see a flag pattern, you can plan to enter once the price breaks out of the rectangle. This is a clear sign that the trend may resume. Traders use flags to set their entry points during a period of consolidation.
Triangles Patterns
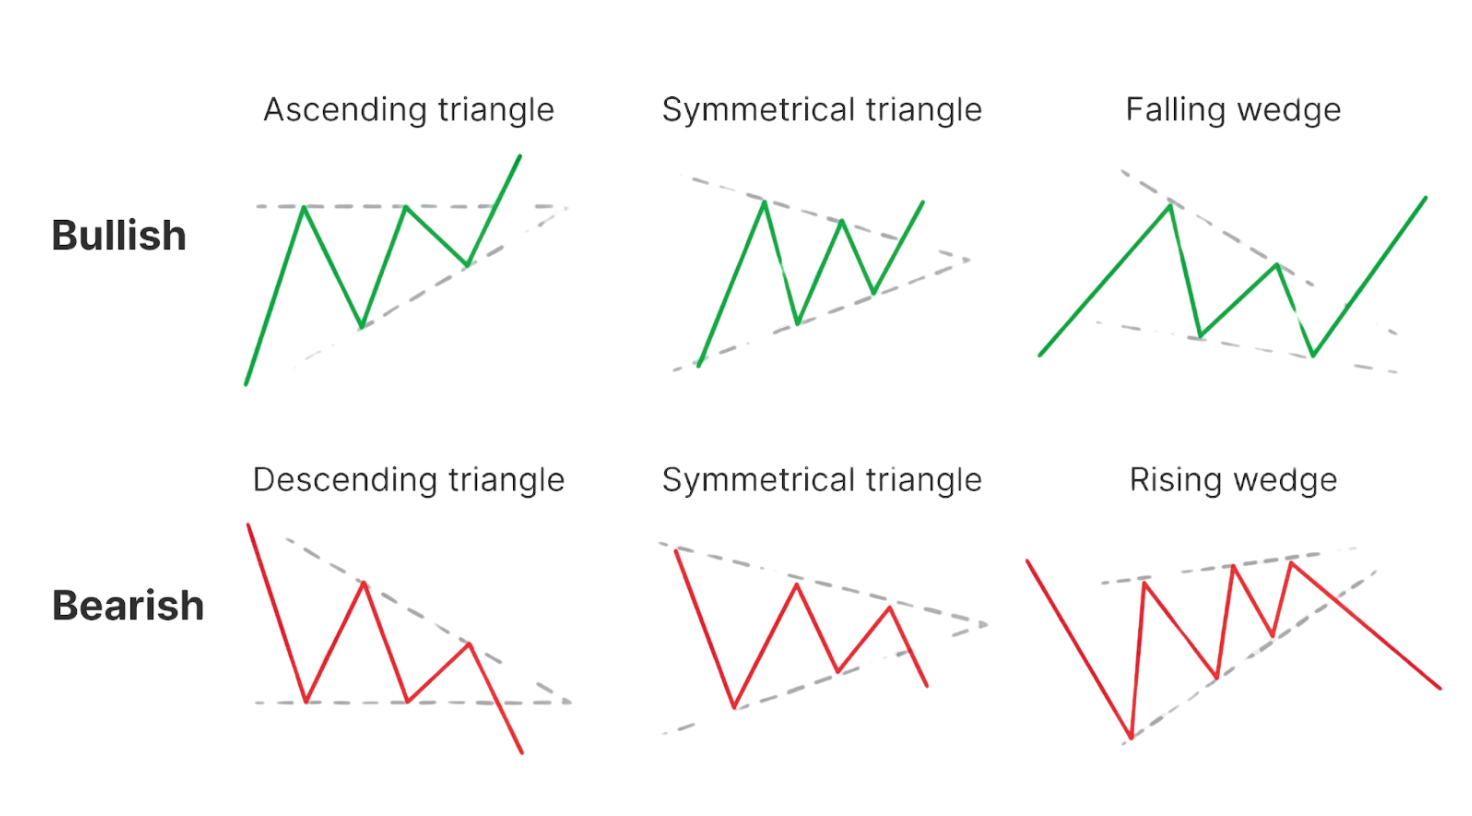
Triangles are very common in stock charts. There are three types:
- Symmetrical Triangles: These form when two trendlines converge as the price moves in a narrowing range. A break from the triangle can signal a strong move. You can set an entry point when the price moves outside the triangle.
- Ascending Triangles: In an ascending triangle, the top line is flat, while the bottom line slopes upward. This pattern is usually a sign of a bullish trend. Traders set their entry points once the price breaks above the flat resistance.
- Descending Triangles: In a descending triangle, the bottom line is flat, and the top line slopes downward. This pattern often points to a bearish trend. When the price breaks below the flat support, it can be a signal to set your entry point for a short trade.
Wedges Patterns
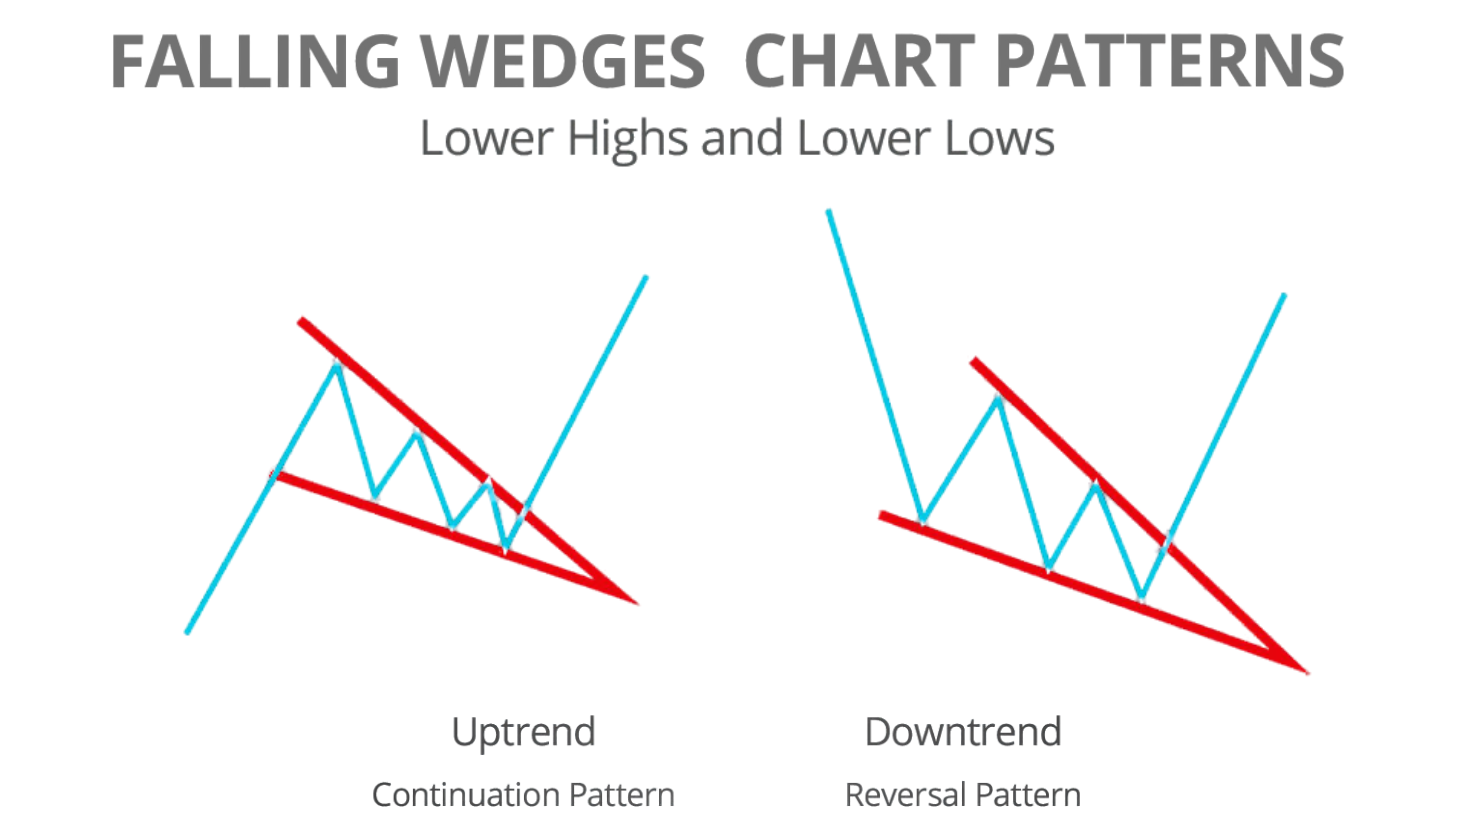
Wedges can be tricky. They come in two forms:
- Rising Wedges: Rising wedges are usually a sign of a bearish reversal in an uptrend. If you see a rising wedge, it might be time to plan an exit or short entry when the price breaks downward.
- Falling Wedges: Falling wedges often signal a bullish reversal in a downtrend. When you see a falling wedge, plan to set your entry point as the price breaks upward.
Cup and Handle
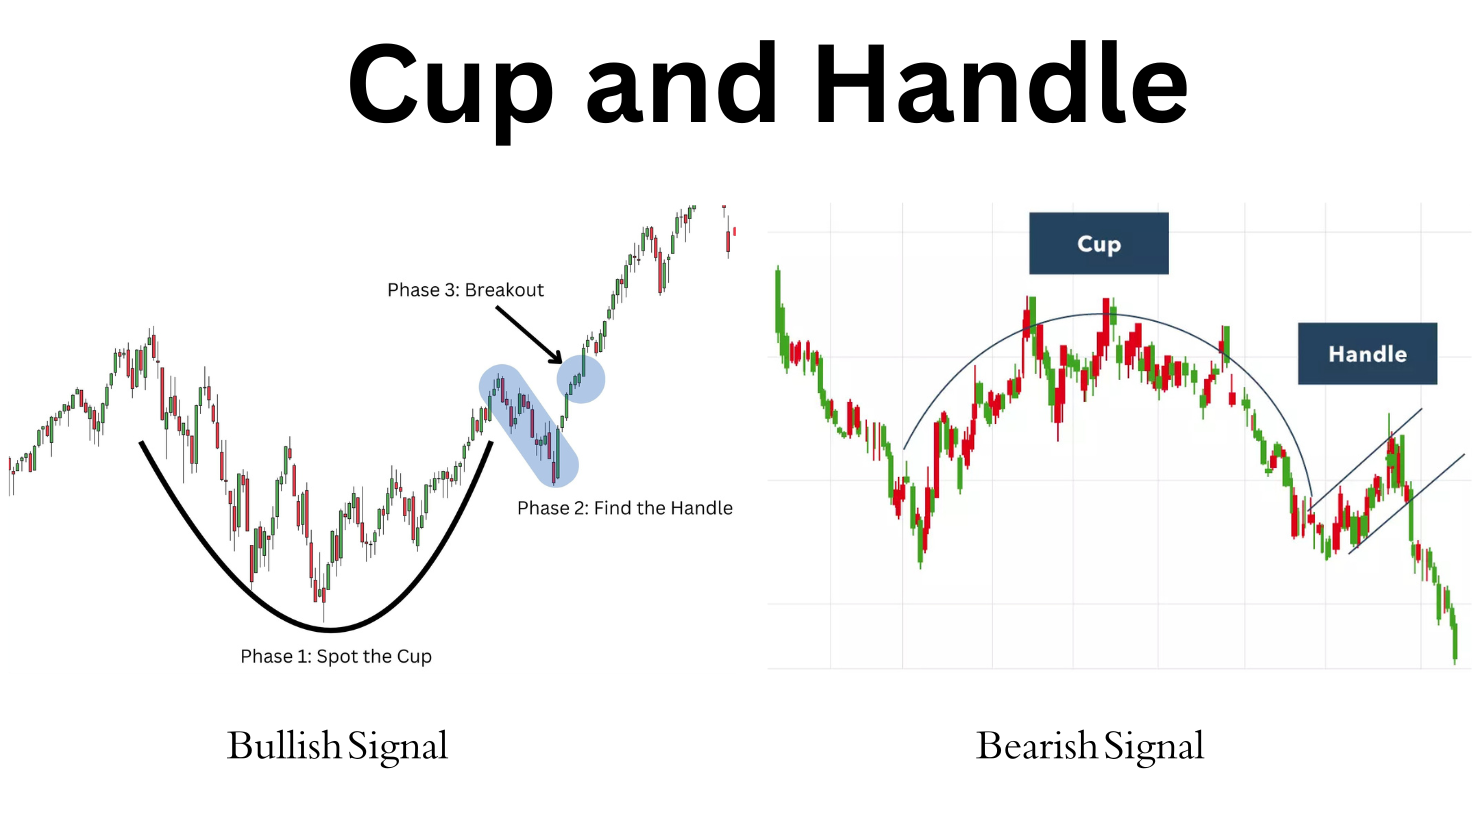
The cup and handle pattern is a bullish continuation pattern. It looks like a cup followed by a short pullback (handle). Once the handle forms and the price breaks the resistance level, it is a strong signal to set an entry point. This pattern helps traders catch a rising market early.
Reversal Patterns
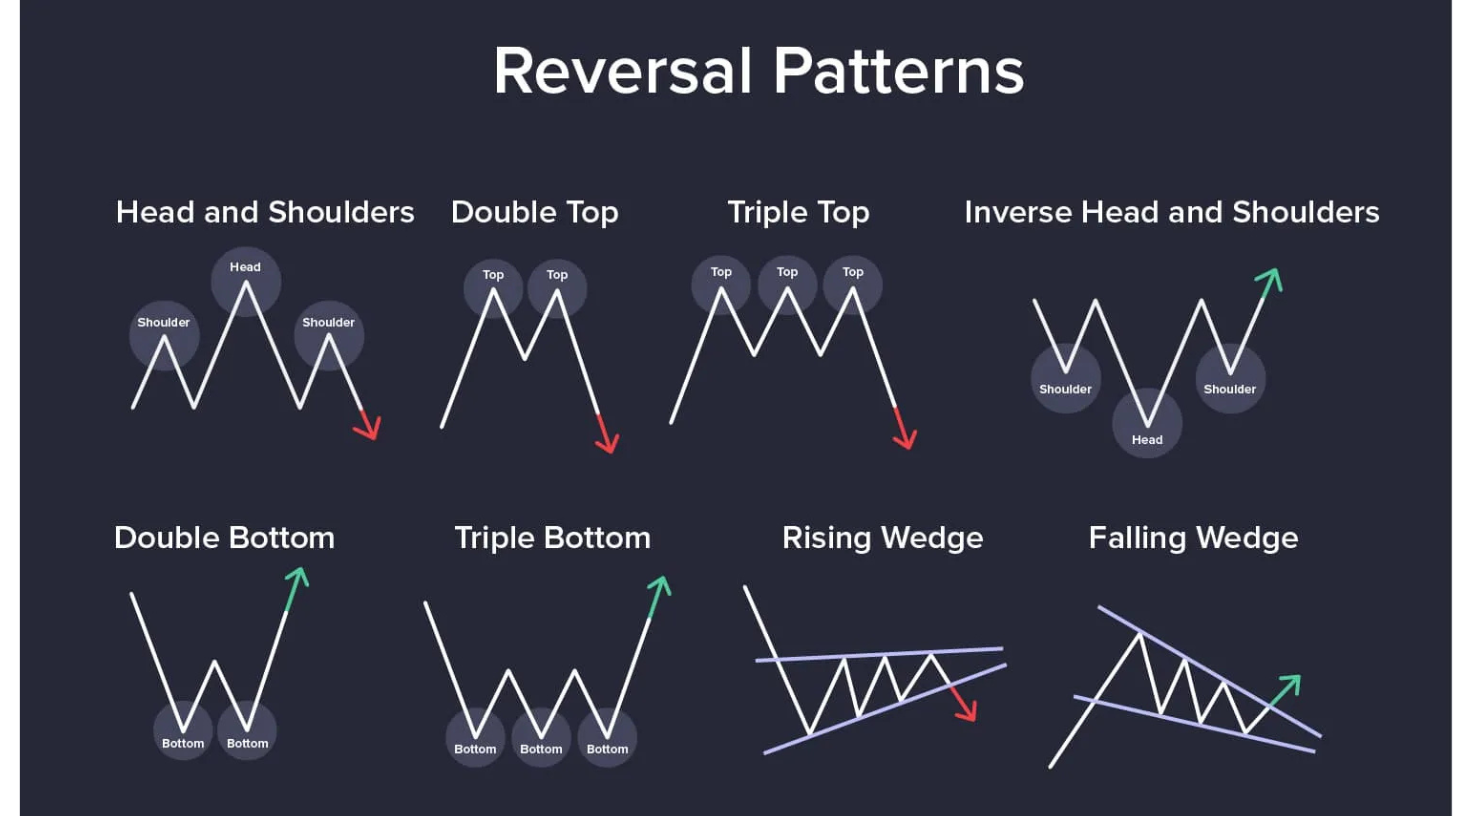
Head and Shoulders: The head and shoulders pattern is one of the most reliable reversal patterns. It forms with three peaks, where the middle peak (head) is higher than the two on the sides (shoulders). A head and shoulders top signals a reversal from an uptrend to a downtrend. Conversely, an inverse head and shoulders pattern signals a reversal from a downtrend to an uptrend. Use these patterns to set both entry and exit points in your trades.
Double Tops and Double Bottoms: Double tops appear when the price makes two peaks at about the same level. This pattern shows that the price has hit resistance twice and may reverse. A double bottom is the opposite and can signal a rising market. These patterns are useful for setting exit points. For example, if a double top forms in an uptrend, you might set your exit point when the price fails to break the resistance level again.
Triple Tops and Triple Bottoms: Triple tops and bottoms are less common but still powerful. They show that the price has tested a support or resistance level three times. When a triple top is confirmed, it can be a strong signal to exit a long trade. Similarly, a triple bottom may signal a good entry point for a long trade.
Gaps Patterns
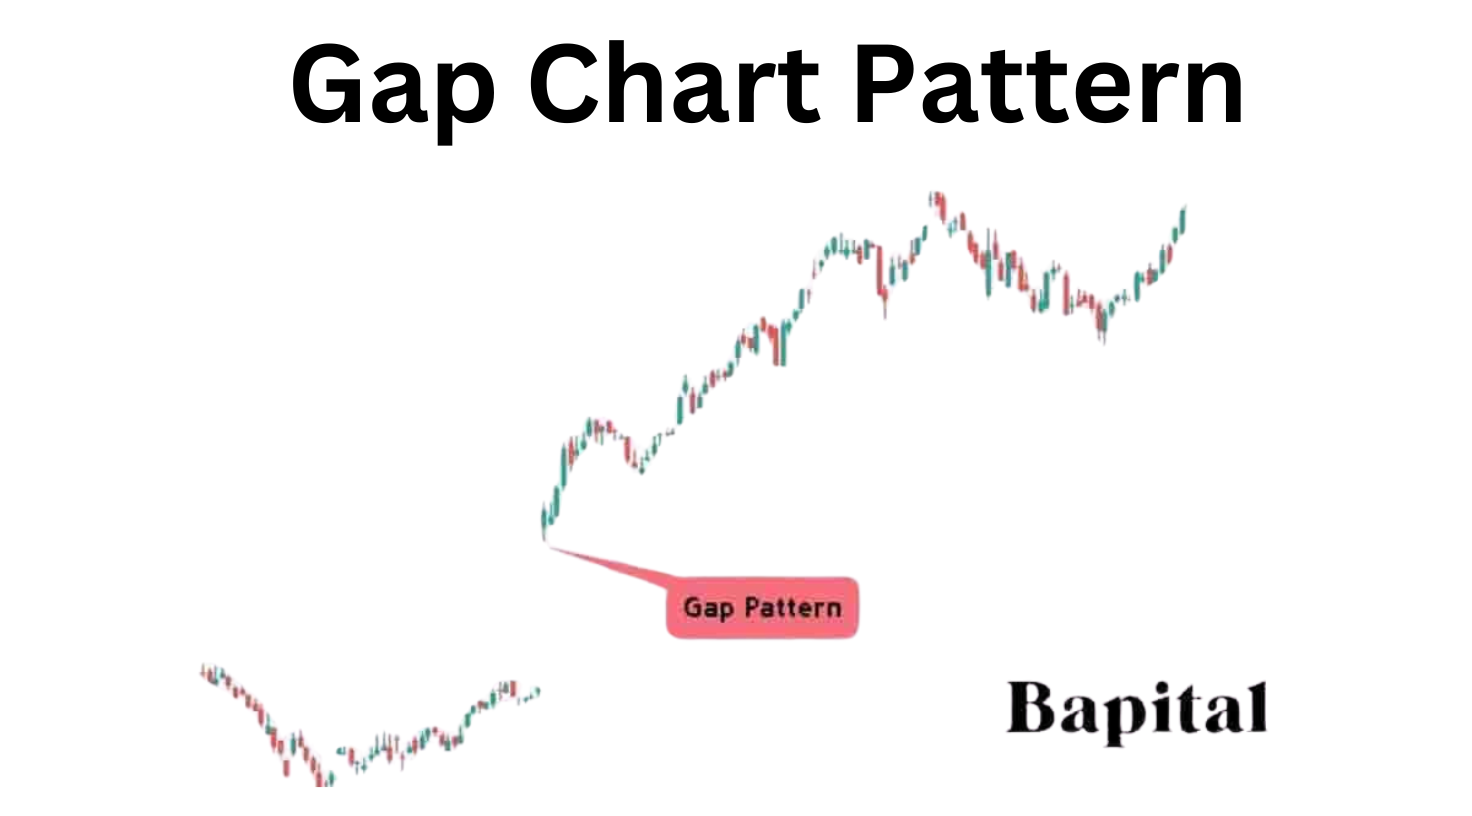
Gaps are sudden jumps in price that leave empty spaces on the chart. There are three types:
- Breakaway Gaps: These gaps appear at the start of a new trend. They can be used to predict strong moves after the gap appears.
- Runaway Gaps: Runaway gaps occur during a strong trend. They help confirm that the trend will continue. Use these gaps to set your entry points as the trend gains strength.
- Exhaustion Gaps: Exhaustion gaps occur near the end of a trend. They signal that the trend may be losing strength and could reverse. These gaps are useful for setting exit points to avoid losses.
How to Read Stock Chart Patterns and Set Effective Entry Points: Step-by-Step Guide

Mastering entry points is essential for successful trading. By understanding stock chart patterns, traders can pinpoint the best moments to enter a trade with confidence. This section outlines a step-by-step guide to identifying key trendlines, support and resistance levels, and confirming breakout signals.
Step 1: Identify Key Trendlines
The first step in reading chart patterns is to draw trendlines. Trendlines are straight lines that connect key price points, such as highs and lows, on a trading chart. They help you visualize the market’s direction and spot potential patterns.
- Uptrends: Connect higher lows to form an upward-sloping trendline.
- Downtrends: Connect lower highs to form a downward-sloping trendline.
- Consolidation: When the price moves sideways, draw horizontal trendlines to identify support and resistance levels.
By identifying these trendlines, you can spot patterns like triangles, wedges, and channels, which are essential for setting entry points.
Step 2: Focus on Support and Resistance Levels
Support and resistance levels are key price points where the market has historically reversed or stalled. These levels act as barriers that the price must break through to continue its trend.
- Support Levels: These are price levels where buying pressure is strong enough to prevent the price from falling further.
- Resistance Levels: These are price levels where selling pressure is strong enough to prevent the price from rising further.
When analyzing stock chart patterns, pay close attention to these levels. A breakout above resistance or below support often signals a new trend and provides an excellent opportunity to enter a trade.
Step 3: Use Technical Analysis Chart Patterns to Set Entry Points
Once you’ve identified a pattern and its key levels, the next step is to set your entry point. Here’s how:
- Breakout Entry: Enter the trade when the price breaks above resistance (for bullish patterns) or below support (for bearish patterns).
- Pullback Entry: Wait for the price to retest the breakout level before entering. This reduces the risk of a false breakout.
For example, if you spot an ascending triangle (a bullish pattern), set your entry point when the price breaks above the resistance level. Similarly, if you identify a head and shoulders top (a bearish pattern), enter the trade when the price breaks below the neckline.
Practical Tips for Confirming Entry Points
To increase the accuracy of your entry points, follow these practical tips:
- Wait for the Pattern to Fully Develop: Don’t jump the gun. Wait until the pattern is complete and the price breaks a key level.
- Analyze Volume and Price Movement: High trading volume during a breakout confirms the pattern’s validity. Low volume, on the other hand, may indicate a false breakout.
- Use Additional Indicators: Combine chart patterns with other technical tools like the Relative Strength Index (RSI) or Moving Average Convergence Divergence (MACD) to confirm your trade decision. For example:
- RSI: If the RSI is overbought (above 70) or oversold (below 30), it can signal a potential reversal.
- MACD: A bullish crossover (when the MACD line crosses above the signal line) can confirm a buy signal.
By following these steps and tips, you can confidently read stock chart patterns and set effective entry points. Remember, patience and discipline are key. Always wait for confirmation before entering a trade, and use additional indicators to validate your decision.
Using Chart Patterns for Exit Strategies in Trading
In trading, knowing when to exit a position is just as important as knowing when to enter. Proper exit strategies help manage risk and maximize profits. Chart patterns are powerful tools for identifying optimal exit points, whether you’re dealing with continuation patterns or reversal patterns.
Exit Points in Continuation Patterns
Continuation patterns, like flags, pennants, and triangles, signal that a trend is likely to continue. Traders can set exit points after a breakout from these patterns. For example, if a stock breaks out of a bullish flag pattern, the price target is often calculated by adding the height of the flagpole to the breakout point. This helps traders lock in profits as the trend continues.
Exit Points in Reversal Patterns
Reversal patterns, such as head and shoulders or double tops/bottoms, indicate a potential trend change. These patterns help traders identify when to exit a position to avoid losses. For instance, if a stock forms a head and shoulders pattern, the exit point is typically set near the neckline breakout. Traders often place stop-loss orders just above or below the breakout level to protect against false breakouts.
How to Combine Chart Patterns with Other Trading Indicators for Better Results
Using chart patterns along with other trading tools can make your trade signals even more reliable. Here’s how you can mix these techniques for improved results.
Combining with Moving Averages
Moving averages help smooth out price data and show the overall trend. When a chart pattern forms near a moving average, it can be a strong sign. For example, if you see an ascending triangle near the 50-day moving average, this may be a good time to set your entry point.
Using RSI and MACD
The Relative Strength Index (RSI) and the Moving Average Convergence Divergence (MACD) are popular tools. They help confirm that the price move is real. When these indicators line up with a chart pattern, your trade decision becomes stronger.
The Power of Confluence
Confluence happens when multiple tools point to the same signal. If a chart pattern, a moving average crossover, and an RSI signal all point to a potential move, this can increase the confidence in your entry or exit point.
These tools are essential for improving the reliability of trades, whether you’re doing swing, day, or zero-day options trading.
The Best Practices for Using Stock Chart Patterns in Trading
Consistency, patience, and risk management are the keys to successful trading using chart patterns. Follow these best practices to improve your trading success.
Consistency Is Key
Stick to your trading plan and use chart patterns consistently. This practice builds trust in your strategy and helps you make more accurate decisions.
Be Patient
Wait for the chart pattern to confirm before you act. Rushing into a trade without confirmation can lead to mistakes. Patience is especially important when trading chart patterns that take time to form.
Practice Good Risk Management
Always use stop-loss orders and set clear take-profit levels. This helps protect your money when a trade does not go as planned. Risk management is an essential part of any trading strategy.
Common Mistakes to Avoid When Using Chart Patterns in Trading

Even experienced traders can make mistakes with chart patterns. Here are some common pitfalls and how to avoid them.
Overtrading
One of the most common mistakes is entering trades too early before the chart pattern is fully confirmed. Wait until the pattern is clear and the signals from other indicators match your analysis.
Ignoring Volume
Volume is a key indicator that supports the validity of a chart pattern. If the volume does not back up the price movement, the signal might be false. Always check the volume before setting your entry or exit points.
Failing to Adjust for Market Conditions
Do not rely solely on chart patterns. External factors like news events, earnings reports, and changes in market sentiment can affect price movements. Always consider the overall market conditions when making trading decisions.
Conclusion
Understanding and applying chart patterns can dramatically improve your trading decisions. Remember, practice is key. The more you study and apply these patterns, the better you’ll become at predicting market movements.
Combine this knowledge with a strong grasp of technical tools and core concepts like what is investing to trade more confidently and profitably. Start analyzing trading chart patterns today and take your trading to the next level!