What is Price Action Trading: From Basic Charts to Profitable Signals
Price action trading is a trading method that uses the direct observation of price movements on charts to identify patterns and market sentiment without relying on external indicators. It enables traders to make clear, strategic decisions based on historical and current price behavior.
Algorithmic trading systems analyzing price movements now dominate modern markets. Understanding price action has become essential for all traders.
Successful traders often rely exclusively on price action. They avoid complicated indicators and focus purely on price movements.
Price action trading looks at a security’s movement over time. It forms the foundation of all technical analysis.
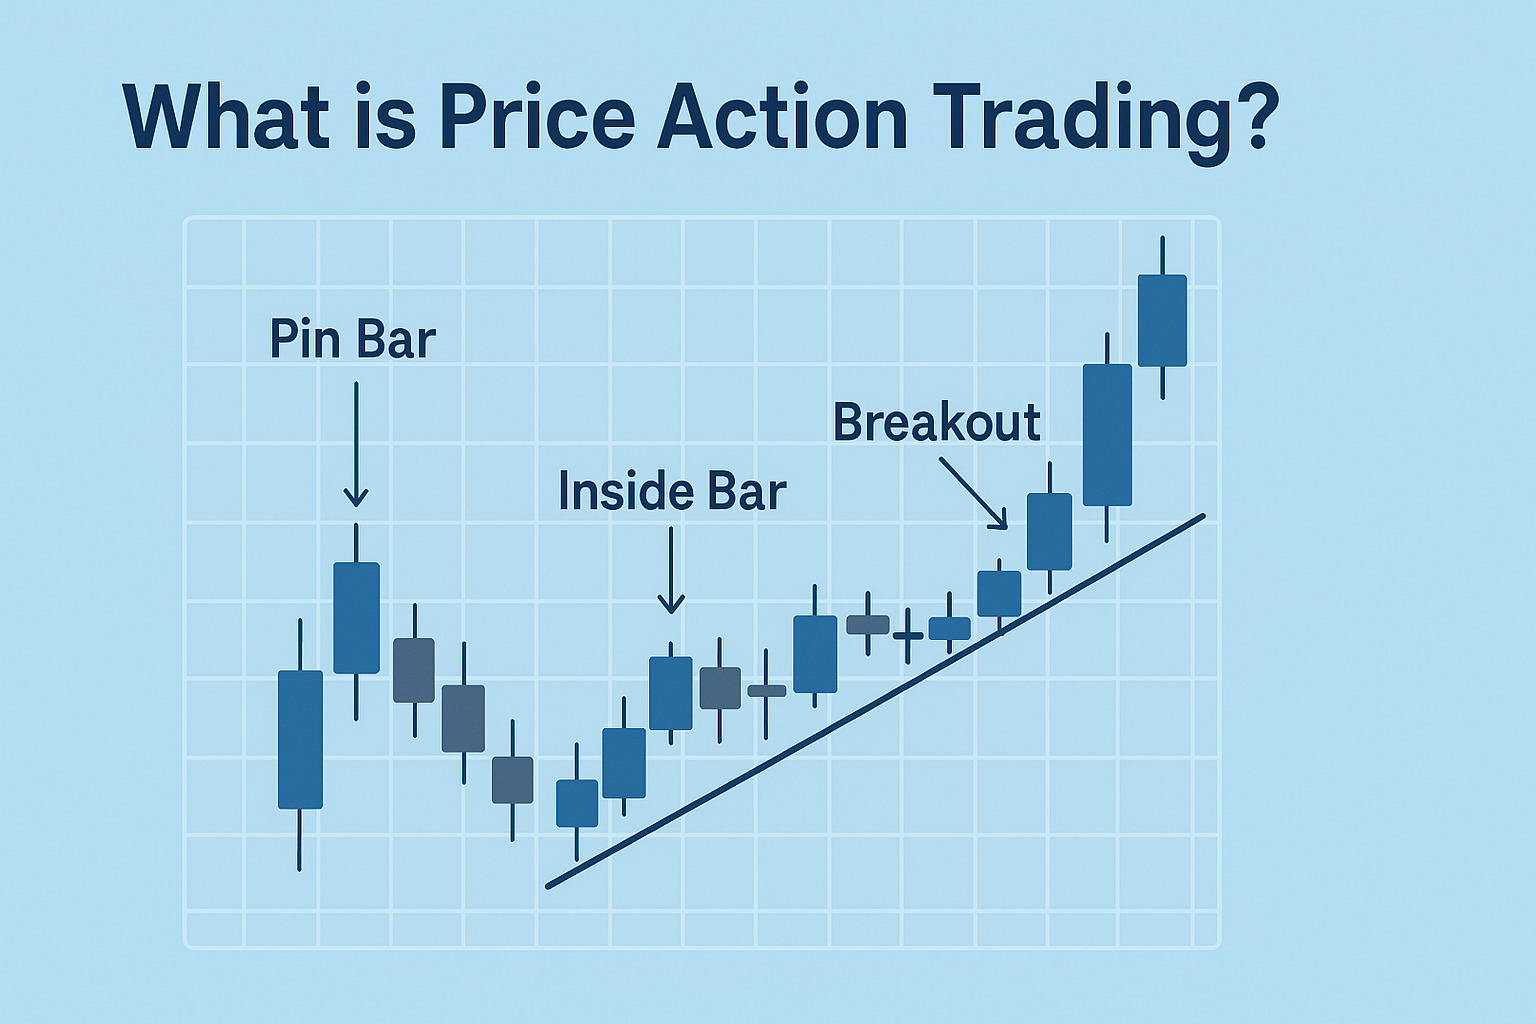
Patterns like inside bars, pin bars, and fakey formations offer strong signals. They’re especially powerful when they appear at confluent market points.
This guide breaks down the fundamentals of price action trading. It’s designed to help both new and experienced traders build effective strategies based on clean, historical data.
- Price action trading involves analyzing pure price movements without relying on technical indicators, using patterns to identify market sentiment.
- Essential price action patterns include pin bars (price rejection), inside bars (consolidation before breakout), and engulfing patterns (momentum shifts).
- Effective price action strategies depend on identifying key support/resistance levels, precise entry triggers, strategic stop-loss, and profit-taking methods.
- Advanced techniques like multiple timeframe confirmation, market structure analysis (higher highs/lows), and volume analysis enhance trading accuracy.
- High-probability price action setups typically involve confluence—situations where multiple technical signals align at key price levels.
Understanding Price Action: The Foundation of Technical Trading
Price action shows how a security’s price moves over time. This simple concept serves as the foundation for all technical trading strategies, whatever their complexity.
What is price action and why does it matter?
Price action shows how a security’s price behaves in the short term. This systematic trading technique helps you read the market and make trading decisions based on actual price movements. You don’t have to rely only on technical indicators. The strategy uses technical analysis tools and recent price history. You can make your own decisions for each scenario.
Price action stands out because of its simplicity and directness. The price itself reflects all available information, sentiment, and market psychology. The price displays everything you need to know about any market. This makes it available to traders of all experience levels.
How price movements reflect market psychology
Charts display prices that show what all market participants believe, know, and do. Price movements capture human emotions like fear, greed, optimism, and pessimism. Buyers control the market when prices go up. Sellers take charge when markets decline.
Several emotional factors shape how market psychology guides price action:
- Fear and greed power market behavior
- Traders follow the crowd due to herd mentality
- Overconfidence makes traders take too many risks
- Traders hold losing positions too long because they fear losses
Price action vs. indicator-based trading approaches
Price action trading is different from indicator-based methods. Both use historical price data but process information differently. Price action looks directly at price movements without filters. Indicator-based trading uses mathematical formulas to calculate secondary values.
These approaches differ in how traders use them. Price action traders prefer “clean” or “naked” charts. They believe this gives them unfiltered market insights. Price action responds right away to market changes. This makes it better than many indicators that need past price data for calculations.
Some say price action trading relies too much on personal judgment. Different traders might read the same chart in different ways. Experience and market knowledge become crucial, especially when markets turn volatile and patterns become less reliable.
Essential Price Action Chart Patterns That Signal Opportunity
Traders who make it big can spot specific chart patterns that keep showing up. These patterns signal good trading opportunities with better odds of success. Let’s look at the most reliable price patterns that are the foundations of winning trading strategies.
Pin bars: Identifying market rejection points
Pin bars are single candlesticks with a long tail (wick) that show clear price rejection. The tail points to where the market pushed back against a price move, which hints at a possible reversal.
A tail that’s much longer than nearby candles sends a stronger signal. Long-tailed pin bars tend to work better. You’ll see bearish pin bars with long upper tails that show the market rejected higher prices.
Bullish pin bars have long lower tails that mean lower prices got rejected. These patterns work best when they pop up at key support or resistance levels or after a pullback in an existing trend.
Inside bars: Capturing consolidation before breakouts
An inside bar shows up when a smaller candlestick fits completely inside the range of the previous “mother bar”. This tells us the market is taking a breather before a possible breakout.
Daily charts are ideal for inside bars because shorter timeframes create too much noise. The setup looks more promising when the inside bar is tiny compared to its mother bar.
You can trade these patterns as trend continuations or reversals from important chart levels. The best results come from trading inside bars that line up with the main trend on daily charts.
Engulfing patterns: When buyers or sellers take control
Engulfing patterns happen when one candle completely covers the previous candle’s body. This suggests momentum might change direction. A bullish engulfing forms when a big green candle swallows up a previous red one, which means buyers are stepping in.
The opposite happens with bearish engulfing patterns – a large red candle covers a green one, showing sellers have taken charge. These patterns hit their target about 63% of the time. They work really well after clean price moves because they clearly show who’s taking control.
Multiple timeframe confirmation techniques
Your trading accuracy jumps when you check patterns on different timeframes. Start with bigger timeframes to see the market’s main direction, then zoom in for precise entry points.
This helps you avoid mistakes by making sure your trades match the bigger picture. The strategy helps you size positions better and place stops smarter because you can see support and resistance more clearly.
When patterns match up across timeframes, this is a big deal as it means that you’re less likely to fall for false signals that often trap traders on shorter timeframes.
Building Your Price Action Trading Strategy Step-by-Step
A profitable price action trading strategy needs a step-by-step system that turns your chart reading abilities into practical trading plans. Let’s create your framework together.
Identifying key support and resistance levels
Support and resistance levels are the foundations of all price action strategies. These levels work as areas where buying and selling pressure reach equilibrium. Support happens when downward price movement pauses because buyers step in.
Resistance shows up when upward movement stalls from too many sellers. These levels work better as “zones” where price historically reacts rather than exact numbers.
Each test makes these levels stronger. The price bounces off a level many times to make it more important. Round numbers also work as psychological barriers where traders place their orders.
Entry triggers that minimize false signals
After spotting key levels, look for specific entry triggers that show market intentions clearly. The best entries happen at strong support and resistance areas and trendlines. You should wait for a “signal bar” to form at these points. This bar could be a trend or reversal bar. Place your entry order one tick above the signal bar for longs or one tick below for shorts. This approach will give a better chance of entering with market momentum instead of against it.
Setting precise stop-loss and take-profit levels
Your stop-loss placement must be strategic. Put stops beyond recent swing lows for long positions or swing highs for shorts. This gives your trade room to breathe. Move stops to breakeven only when price hits strategic levels—not just to protect your ego. Set profit targets at previous levels of support/resistance or “elbows” where price turns. Exact highs and lows rarely get hit, so avoid setting targets there.
Position sizing based on chart patterns
Calculate position size by dividing your maximum account risk (usually 2% per trade) by your trade risk from entry to stop-loss. To cite an instance, a $500 risk on a trade with $20 per share risk means buying 25 shares. Market conditions should guide your position sizes. Use smaller sizes in volatile markets that need wider stops. You might increase size a bit for high-probability setups with multiple confluences.
Advanced Price Action Concepts for Consistent Profitability
Price action trading requires more than simple chart patterns. Traders who consistently make profits know advanced price action concepts that set them apart from others who struggle. These sophisticated techniques help them learn about market behavior and spot high-probability trades.
Market structure: Higher highs, lower lows, and trend analysis
Price action trading’s life-blood is market structure. It forms the basis of almost every trading decision. Buyers show increasing confidence in uptrends by creating a series of higher highs and higher lows. The opposite happens in downtrends where lower highs and lower lows show sellers taking control.
Understanding these structural elements makes trend identification simple:
- Uptrends: Each peak exceeds the previous one (higher highs) with each trough higher than the last (higher lows)
- Downtrends: Each peak falls below the previous one (lower highs) with each trough lower than the last (lower lows)
- Sideways markets: No clear pattern of higher highs/lows or lower highs/lows
Changes in market structure often hint at possible trend reversals. To cite an instance, buyers might be taking control when a downtrend suddenly shows a higher high.
Order flow and volume analysis with price action
Price changes happen mainly because of order flow – the sum of all buy and sell orders. Studying order flow and volume reveals what market participants plan to do. Large institutional players’ orders can substantially influence market direction.
Strong price movements need volume confirmation. High volume during breakouts shows momentum that’s likely to continue, while low volume shows weakness. Markets with narrow spreads show good liquidity and price agreement. Wide spreads indicate uncertainty or poor liquidity.
Watch these volume signals closely:
- Rising price with increasing volume shows strong bullish pressure
- Rising price with decreasing volume hints at a weakening uptrend
- Falling price with increasing volume indicates strong bearish pressure
- Falling price with decreasing volume suggests a weakening downtrend
Confluence factors that strengthen trading signals
Trading confluence happens when multiple technical factors line up to verify a trade decision. This strategic approach filters out weaker setups and focuses on trades with better success rates.
The strongest confluence factors include:
- Price action signals at key support/resistance levels
- Multiple timeframe confirmation of the same signal
- The setup lines up with broader market structure (trend direction)
- Order flow and volume confirmation
- Fibonacci retracement levels matching chart patterns
Success rates improve when several elements meet at a single point—creating a “hot point” in the market. Smart traders wait patiently for these high-confidence setups instead of jumping at every signal.
Conclusion
Price action trading is a powerful method that simplifies market complexity by focusing on pure price movements. This piece shows how price patterns reflect market psychology and give clear trading signals without complex indicators.
Pin bars, inside bars, and engulfing patterns give you reliable tools to spot potential market moves. These patterns work with proper support and resistance analysis to create high-probability trading opportunities.
Your success in price action trading comes from being systematic. The approach has careful position sizing, strategic stop-loss placement, and multiple confluence factors before trades. Market structure analysis and order flow add more confirmation to your trading decisions.
Price action trading needs patience and discipline. Don’t chase every possible setup. Look for trades where multiple technical factors come together at key price levels. This systematic approach with proper risk management helps build consistent profits in your trading experience.
Frequently Asked Questions
1. What exactly is price action trading?
Price action trading is a method that focuses on analyzing the movement of a security’s price over time, without relying on indicators. Traders use this approach to make decisions based on price patterns, chart formations, and market structure.
2. How does price action reflect market psychology?
Price movements capture the collective emotions and decisions of market participants. For example, uptrends with higher highs and higher lows indicate increasing buyer confidence, while downtrends with lower highs and lower lows signal growing seller dominance.
3. What are some key price action patterns to look for?
Important price action patterns include pin bars (showing rejection of price levels), inside bars (indicating consolidation before potential breakouts), and engulfing patterns (signaling potential momentum shifts). These formations can provide valuable trading signals when they appear at key support or resistance levels.
4. How can I build a price action trading strategy?
To develop a price action strategy, start by identifying key support and resistance levels, wait for specific entry triggers at these levels, set precise stop-loss and take-profit points, and determine position sizes based on your risk tolerance. It’s also crucial to analyze patterns across multiple timeframes for confirmation.
5. What advanced concepts can improve price action trading results?
Advanced price action concepts include analyzing market structure (higher highs/lows and trend direction), incorporating order flow and volume analysis, and looking for confluence factors where multiple technical elements align. These techniques can help filter out low-probability setups and focus on high-confidence trades.