On-Balance Volume (OBV) is a momentum indicator that tracks volume flow to anticipate stock price movements. Created by Joe Granville in 1963, OBV identifies bullish or bearish trends by comparing changes in stock prices with corresponding volume patterns. The basic idea is straightforward: when a stock’s price increases along with rising volume, it signals a robust bullish trend; however, if the price climbs while volume diminishes, it may indicate weakening momentum or a possible reversal.
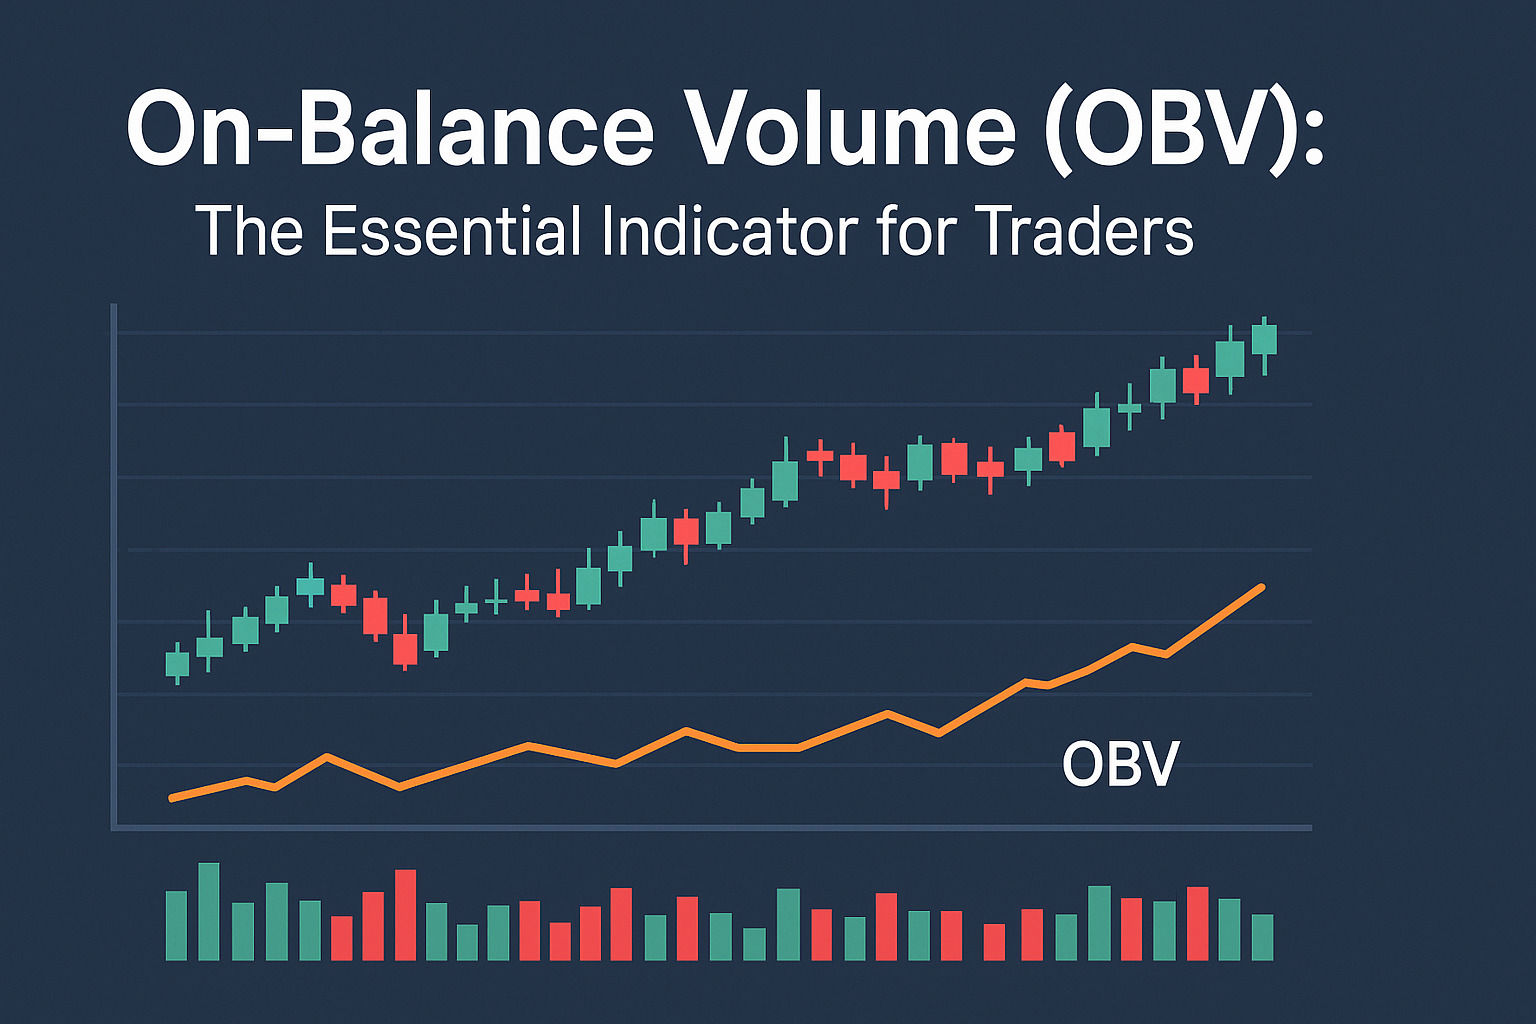
On-Balance Volume (OBV): The Essential Indicator for Traders
Published by: James Harrison
Last Updated On:
June 10, 2025
Definition
OBV is a momentum-based technical indicator that measures cumulative volume changes relative to price movement. It helps traders confirm trend strength, spot divergences, and anticipate breakouts by tracking whether volume supports or contradicts price action.
On-Balance Volume (OBV) is a powerful technical analysis tool that helps traders make more informed decisions about market trends. Used primarily in the stock and forex markets, the OBV indicator evaluates the flow of volume alongside price movements to predict future market behavior.
This article explores the OBV meaning, its calculation, how it works, and its significance in trading strategies.
Key Takeaways
- On-Balance Volume (OBV) uses volume flow to confirm trends, forecast reversals, and validate breakouts.
- OBV rises when prices close higher and falls when prices close lower—tracking buying or selling pressure.
- Divergence between OBV and price can signal upcoming reversals.
- OBV is best used with other indicators like moving averages or momentum tools to avoid false signals.
- While simple and powerful, OBV can lag and shouldn’t be relied on alone in volatile or low-volume markets.
What is On-Balance Volume (OBV)?
How Does the OBV Indicator Work?
The OBV indicator works by adding or subtracting the volume on each day based on the stock’s price movement:
- If the stock price closes higher than the previous day’s close, the day’s volume is added to the OBV.
- If the stock price closes lower, the day’s volume is subtracted from the OBV.
- If the stock price closes unchanged, the OBV remains the same.
This cumulative indicator tracks the flow of volume over time, making it useful for identifying trends or market turning points.
OBV Formula
The OBV is calculated using the following rules:
- If the closing price is higher than the previous day’s closing price:
OBV = Previous OBV + Current Volume - If the closing price is lower than the previous day’s closing price:
OBV = Previous OBV – Current Volume - If the closing price is the same:
OBV = Previous OBV
By plotting OBV alongside price charts, traders can visually assess whether the volume supports the current price trend.
How to Use the OBV Indicator in Trading
Traders and analysts use the OBV to confirm price trends, spot reversals, and identify potential breakout points. Here are some common ways to use OBV in a trading strategy:
1. Confirming Trend Direction
A rising OBV typically confirms an uptrend, while a falling OBV confirms a downtrend. The idea is that when OBV increases with rising prices, it suggests that the trend is supported by buying volume. Similarly, a decrease in OBV while prices are rising may indicate a weakening uptrend.
2. Identifying Divergence
Divergence between OBV and price is a strong signal of a potential trend reversal:
- Bullish Divergence: When the price forms lower lows, but OBV is making higher lows, this suggests that despite falling prices, buying interest is increasing. This could signal a reversal to the upside.
- Bearish Divergence: Conversely, if the price forms higher highs, but OBV is making lower highs, it may indicate that despite rising prices, selling pressure is increasing, signaling a possible reversal to the downside.
3. Predicting Breakouts
OBV is also used to predict price breakouts. When OBV moves in the same direction as the price during a breakout, it validates the breakout’s strength. A significant OBV move preceding or during a breakout suggests that the trend is likely to continue.
4. OBV and Moving Averages
Traders often combine OBV with moving averages to smooth out its fluctuations and highlight long-term trends. A simple strategy is to plot a moving average of the OBV, and when the OBV crosses above the moving average, it might signal a buying opportunity. Conversely, when OBV crosses below the moving average, it could be a sell signal.
OBV vs. Other Volume Indicators
While OBV is a unique volume-based indicator, it’s useful to compare it to other similar tools like the Accumulation/Distribution (A/D) line and the Chaikin Money Flow (CMF).
- OBV vs. A/D Line: The A/D line is similar to OBV but takes into account the range of the day’s price, not just whether it closed higher or lower. The A/D line incorporates the price relative to the day’s high/low to give more context to the volume. However, OBV’s simplicity and easy calculation make it an attractive choice for many traders.
- OBV vs. CMF: The CMF is another volume-based indicator that calculates the money flow over some time. The CMF considers both price and volume, while OBV focuses solely on price direction and volume. Traders often use both in conjunction to cross-check market sentiment.
Advantages of Using OBV
- Simplicity: OBV is easy to calculate and interpret. It’s a straightforward volume-based indicator that doesn’t require complex calculations.
- Trend Confirmation: OBV is great for confirming the strength of a price trend, helping traders avoid entering trades when the trend is weak or about to reverse.
- Volume Clarity: OBV provides a clearer picture of the relationship between price and volume, helping traders assess whether the current price movement is supported by strong trading volumes.
Limitations of the OBV Indicator
While OBV is a useful tool, it does have its limitations:
- False Signals: Like all technical indicators, OBV can sometimes produce false signals, especially in volatile markets or during periods of low liquidity.
- Lagging Indicator: OBV is based on historical data and can lag price action, leading to delayed signals.
- Limited Standalone Use: OBV should not be used in isolation. It is most effective when combined with other technical indicators, such as moving averages or momentum indicators, to increase the reliability of trade decisions.
Conclusion
The OBV indicator is a vital tool for traders who seek to understand the relationship between volume and price movements. By using OBV, traders can gain insights into market trends, identify potential reversals, and make more informed trading decisions. However, like all technical indicators, OBV should be used in conjunction with other tools and analysis techniques to ensure better accuracy.
Whether you’re a novice or an experienced trader, mastering the OBV indicator can provide a clearer understanding of the forces driving market movements. By monitoring volume flow about price changes, OBV can help you stay ahead of trends and improve your trading strategy.