Triangle Patterns in Trading

Triangle Pattern: A chart formation created by converging trend lines—one acting as resistance and the other as support—that signals a period of consolidation before a potential breakout or breakdown. These patterns help traders anticipate future price movements and set clear entry and exit points.
Triangle pattern trading is one of the most powerful tools in technical analysis, helping traders predict market trends, spot breakouts, and identify reversals. Triangle patterns provide clear visual signals about price movements, whether you’re trading stocks, forex, or cryptocurrencies. These patterns are formed by converging trend lines—upper resistance and lower support—that create a triangle shape on the chart. As the price moves closer to the tip of the triangle, it often breaks out or breaks down, signaling the next big move.
In this guide, we’ll explore the different types of triangle patterns, how they work, and how to trade them effectively. By the end, you’ll know to use triangle patterns to make smarter trading decisions and improve your strategy.
- Clear Entry/Exit Points: Triangle patterns provide well-defined areas to enter or exit trades based on breakouts or breakdowns.
- Types of Patterns: There are three primary types—ascending (bullish), descending (bearish), and symmetrical (neutral).
- Market Signals: The patterns indicate the balance between buying and selling pressures, often signaling a shift in market direction.
- Versatile Applications: They work across different markets and can be combined with other technical indicators for enhanced trading decisions.
- Risk Management: Proper confirmation via volume and wait for decisive breakouts are essential to avoid false signals.
What Are Triangle Patterns in Trading?
Triangle patterns are chart formations created by converging trend lines that connect a series of highs and lows. These patterns are a key part of technical analysis and help traders predict future price movements. The upper trendline acts as resistance, while the lower trendline serves as support. As the price moves closer to the tip of the triangle, it often breaks out or breaks down, signaling the next big move.
Triangle patterns are especially useful because they provide clear entry and exit points, making them a favorite among traders.
💡 To sharpen your trading accuracy, it’s helpful to also understand how to use chart patterns like triangles, flags, and wedges to identify high-probability entry and exit points.
How Triangle Patterns Work in Trading
Triangle patterns work by showing the battle between buyers and sellers. The upper trendline represents resistance, where sellers take control, and the lower trendline represents support, where buyers step in. As the price moves between these two lines, it creates a triangle shape.
When the price breaks above the upper trendline, it’s called a breakout, signaling a potential upward move. When it breaks below the lower trendline, it’s called a breakdown, indicating a possible downward move. Traders use these breakouts and breakdowns to make buy or sell decisions.
Types of Triangle Patterns
There are three main types of triangle patterns in trading:
- Ascending Triangle Pattern
- Descending Triangle Pattern
- Symmetrical Triangle Pattern
Each type has its own characteristics and provides unique signals about market direction. Let’s explore each one in detail.
Ascending Triangle Pattern: A Bullish Signal
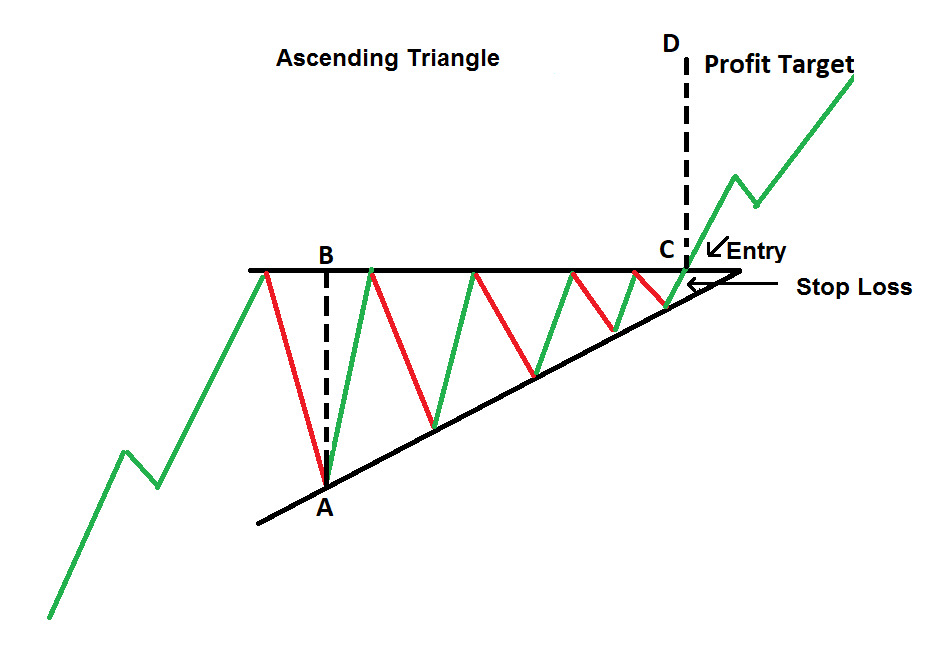
The ascending triangle pattern is a popular technical analysis tool used by traders to identify potential bullish breakouts. This pattern is characterized by two key trendlines: a horizontal upper trendline, which acts as a resistance level, and a rising lower trendline, which connects a series of higher lows.
The convergence of these trendlines forms a triangle, signaling a period of consolidation before a potential upward breakout. The horizontal upper trendline represents a price level where selling pressure has consistently prevented the asset from moving higher.
On the other hand, the rising lower trendline indicates increasing buying pressure, as buyers are willing to purchase the asset at progressively higher prices. This dynamic creates a squeeze in price action, often leading to a breakout above the resistance level.
The ascending triangle is considered a bullish pattern because it reflects a buildup of demand. As the price approaches the apex of the triangle, the likelihood of a breakout increases. Traders often look for a surge in trading volume to confirm the breakout, as this indicates strong buying interest.
Real-world examples of the ascending triangle pattern can be found in both stock and crypto markets. For instance, in 2020, Bitcoin formed an ascending triangle before breaking out and rallying to new all-time highs. Similarly, Tesla (TSLA) exhibited this pattern in early 2023, leading to a significant upward move. These examples highlight the pattern’s reliability in signaling potential bullish opportunities when combined with other technical indicators and market context.
Descending Triangle Pattern: A Bearish Signal
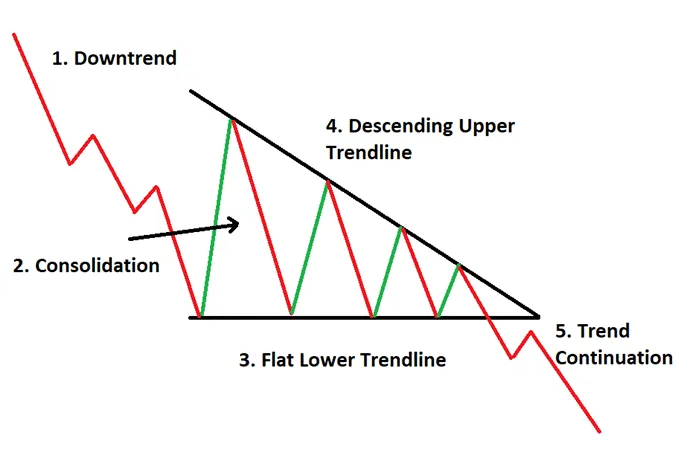
The descending triangle pattern is a bearish chart formation commonly observed in technical analysis, signaling potential breakdowns and continuation of a downtrend. It is characterized by its distinct structure, which consists of two key trendlines: a horizontal lower trendline acting as support and a declining upper trendline representing lower highs.
This pattern reflects a period of consolidation where sellers gradually gain control, pushing the price lower while buyers struggle to break through the resistance. The horizontal support line indicates a level where buying interest has historically prevented the price from falling further.
However, the declining upper trendline shows that each rally is weaker than the previous one, as sellers become more aggressive. This creates a series of lower highs, tightening the price action into a triangle shape. The convergence of these trendlines suggests that a breakout is likely, with the pattern typically resolving in a downward direction.
The bearish nature of the descending triangle lies in its implication of weakening demand and increasing selling pressure. Traders often anticipate a breakdown below the support level, which can lead to a significant decline in price. Volume analysis can further confirm the pattern, as a breakout accompanied by high volume adds credibility to the bearish signal.
For example, in a trading scenario, a stock might form a descending triangle after a prolonged downtrend. As the price approaches the apex of the triangle, a breakdown below support could trigger a sell-off, with traders entering short positions or exiting long ones. Real-world examples include Bitcoin’s price action in early 2021, where a descending triangle preceded a sharp decline, validating the pattern’s predictive power. Overall, the descending triangle serves as a reliable tool for traders to identify potential bearish opportunities.
Symmetrical Triangle Pattern: The Neutral Indicator
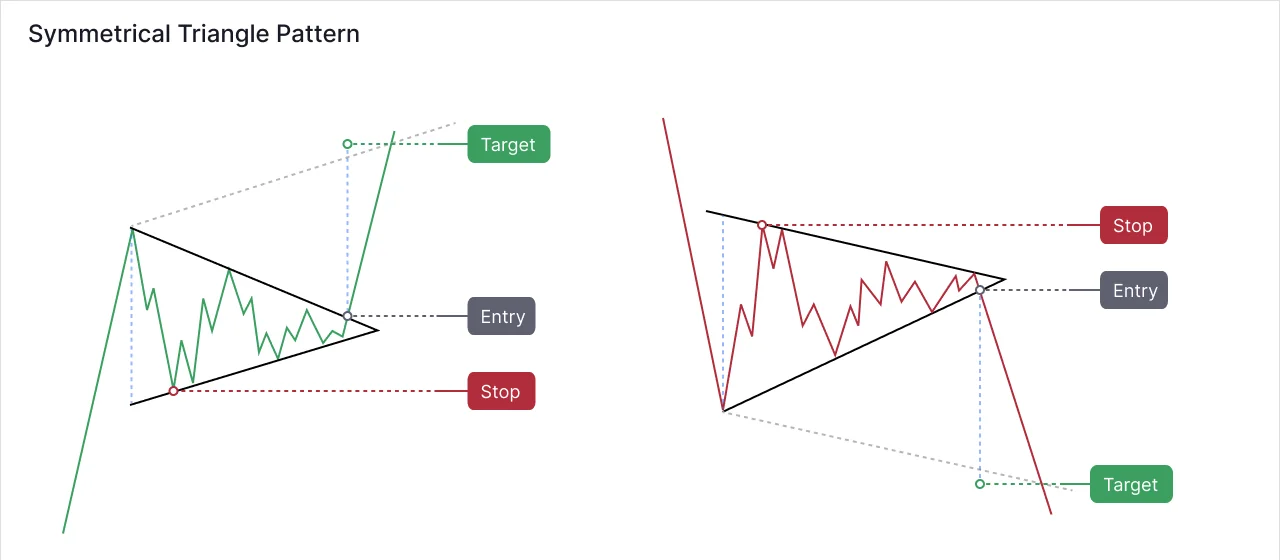
The symmetrical triangle pattern is a common chart formation in technical analysis that represents a period of consolidation before the price breaks out in either direction. It is considered a neutral indicator because it does not inherently favor a bullish or bearish outcome, making it essential for traders to wait for a confirmed breakout before taking a position.
Structure of the Symmetrical Triangle
The pattern is characterized by two converging trendlines: a diagonal upper trendline connecting lower highs and a diagonal lower trendline connecting higher lows. These trendlines slope towards each other symmetrically, forming a triangle shape. The convergence of the trendlines reflects a balance between buyers and sellers, as neither side gains significant control during the consolidation phase. The price typically oscillates within the triangle, with the range narrowing as the pattern progresses.
Bullish or Bearish Breakouts
The symmetrical triangle is known for its potential to lead to either bullish or bearish breakouts. A bullish breakout occurs when the price breaks above the upper trendline, signaling a potential upward trend. Conversely, a bearish breakout happens when the price breaks below the lower trendline, indicating a potential downward trend. Traders often look for increased volume and strong momentum to confirm the validity of the breakout, as false breakouts can occur.
Role as a Continuation Pattern
The symmetrical triangle is primarily a continuation pattern, meaning it typically forms during a trend and signals a pause before the trend resumes. For example, in an uptrend, the pattern may form as a temporary consolidation before the price breaks out upward to continue the bullish trend. Similarly, in a downtrend, it may precede a bearish continuation. However, it can also act as a reversal pattern in rare cases, depending on market conditions.
In summary, the symmetrical triangle pattern is a versatile tool for traders, offering insights into potential breakouts while emphasizing the importance of patience and confirmation before making trading decisions.
How to Trade Triangle Patterns Effectively
Triangle pattern trading is a popular technical analysis strategy traders use to identify potential breakout or breakdown opportunities in the market. These patterns are formed when the price of an asset consolidates between converging trendlines, creating a triangular shape. To trade triangle patterns effectively, follow these actionable steps:
1. Identify the Pattern on a Price Chart
The first step in triangle pattern trading is to accurately identify the pattern on a price chart. There are three main types of triangle patterns:
- Ascending Triangle: Characterized by a flat upper trendline (resistance) and a rising lower trendline (support).
- Descending Triangle: Defined by a flat lower trendline (support) and a declining upper trendline (resistance).
- Symmetrical Triangle: Formed by two converging trendlines, one sloping downward and the other upward, indicating a balance between buyers and sellers.
Look for at least two swing highs and two swing lows to confirm the formation of a triangle pattern. The more times the price touches the trendlines, the more reliable the pattern becomes.
2. Wait for a Confirmed Breakout or Breakdown
Once you’ve identified a triangle pattern, the next step is to wait for a confirmed breakout or breakdown. A breakout occurs when the price moves above the upper trendline (in the case of an ascending or symmetrical triangle), while a breakdown happens when the price falls below the lower trendline (in the case of a descending or symmetrical triangle).
Avoid entering trades prematurely, as false breakouts are common. Wait for the price to close decisively outside the trendline to confirm the breakout or breakdown.
3. Use Volume Indicators to Validate the Breakout
Volume is a critical factor in validating triangle pattern trading. A genuine breakout is often accompanied by a significant increase in trading volume, indicating strong market participation. Conversely, a breakout with low volume may signal a false move.
Use volume indicators, such as the On-Balance Volume (OBV) or Volume Weighted Average Price (VWAP), to confirm the strength of the breakout. High volume during a breakout increases the likelihood of a sustained price movement.
4. Set Stop-Loss and Take-Profit Levels
Risk management is essential in triangle pattern trading. Always set stop-loss and take-profit levels to protect your capital and lock in profits.
- Stop-Loss: Place your stop-loss just below the breakout level for a long trade or above the breakdown level for a short trade. This helps minimize losses if the price reverses.
- Take-Profit: Calculate the take-profit level by measuring the height of the triangle at its widest point and projecting that distance from the breakout point. This method is known as the “measured move” and provides a realistic profit target.
By following these steps, you can effectively trade triangle patterns and improve your chances of success in the market.
Common Mistakes to Avoid in Triangle Pattern Trading
While triangle pattern trading can be highly profitable, traders often make mistakes that lead to losses. Here are some common pitfalls and tips to avoid them:
1. Trading Before a Confirmed Breakout
One of the most common mistakes in triangle pattern trading is entering a trade before a confirmed breakout. False breakouts occur when the price briefly moves beyond the trendline but quickly reverses. To avoid this, wait for a decisive close outside the trendline and confirm the move with volume indicators.
2. Ignoring Volume Indicators
Volume is a key component of triangle pattern trading, yet many traders overlook it. A breakout without significant volume is often unreliable and may result in a false signal. Always use volume indicators to validate the strength of the breakout or breakdown.
3. Misidentifying the Pattern Type
Misidentifying the type of triangle pattern can lead to incorrect trading decisions. For example, confusing an ascending triangle with a symmetrical triangle may cause you to misinterpret the market’s direction. Take the time to study and correctly identify the pattern before placing a trade.
- Be patient and wait for confirmation before entering a trade.
- Use multiple technical indicators to validate your analysis.
- Continuously educate yourself on pattern recognition and technical analysis.
By avoiding these common mistakes, you can enhance your triangle pattern trading strategy and achieve better results.
Triangle Patterns in Different Markets
Triangle patterns are versatile and can be applied across various markets, including stocks, forex, and cryptocurrencies. Here’s how they are used in different contexts:
Stocks: Examples of Ascending and Descending Triangles in Equity Trading
Triangle patterns are commonly used in the stock market to identify potential breakouts. For example, an ascending triangle pattern in a stock chart may indicate that buyers are gaining strength, leading to a bullish breakout. Conversely, a descending triangle pattern may signal that sellers are in control, resulting in a bearish breakdown.
Forex: How Triangle Patterns Predict Currency Movements
In the forex market, triangle patterns are used to predict currency movements. For instance, a symmetrical triangle pattern in a currency pair may suggest that the market is consolidating before a significant move. Traders can use these patterns to anticipate breakouts and capitalize on currency trends.
Crypto: Role of Triangle Patterns in Volatile Crypto Markets
Cryptocurrency markets are known for their volatility, making triangle patterns particularly useful. In crypto trading, triangle patterns can help identify potential breakout points in highly volatile assets like Bitcoin or Ethereum. However, traders should exercise caution and use additional indicators to confirm signals due to the market’s unpredictability.
Combining Triangle Patterns with Other Technical Indicators
To enhance the accuracy of triangle pattern trading, consider combining these patterns with other technical indicators:
1. Moving Averages
Moving averages can help confirm the trend direction and provide dynamic support or resistance levels. For example, a breakout above a key moving average may strengthen the bullish case for an ascending triangle pattern.
2. Relative Strength Index (RSI)
The RSI is a momentum oscillator that measures overbought or oversold conditions. If the RSI is above 70 during a breakout, it may indicate overbought conditions, suggesting a potential pullback. Conversely, an RSI below 30 may signal oversold conditions during a breakdown.
3. Fibonacci Retracement
Fibonacci retracement levels can help identify potential support or resistance levels after a breakout. For example, if the price breaks out of a symmetrical triangle, traders can use Fibonacci levels to determine where the price might retrace before continuing in the breakout direction.
By combining triangle patterns with these indicators, traders can improve their analysis and make more informed trading decisions.
The Bottom Line
Triangle pattern trading is a powerful tool in technical analysis, offering traders the ability to identify potential breakout or breakdown opportunities. However, mastering this strategy requires practice, patience, and a thorough understanding of market dynamics.
Remember that markets are inherently unpredictable, and no strategy is foolproof. Always prioritize risk management and use multiple indicators to validate your analysis. By consistently applying these principles, you can improve your triangle pattern trading skills and achieve long-term success in the markets.
Whether you’re trading stocks, forex, or cryptocurrencies, triangle pattern trading can provide valuable insights into market trends and help you make informed trading decisions. Keep practicing, stay disciplined, and always be prepared for the unexpected.